Essential Maintenance Metrics Every Planner Needs to Know
Get Free Guide
How to Track and Analyze Equipment & Machine Downtime
A handful of problem machines usually drive most of your unplanned downtime — but when you run dozens or hundreds of assets, they’re hard to spot. This is a practical, two-stage method for finding those problem machines in your data and fixing the real root cause, not just the symptom.
Key takeaways
- Downtime reports hide your costliest equipment. With many assets, the problem machines don’t announce themselves — you have to surface them from the data.
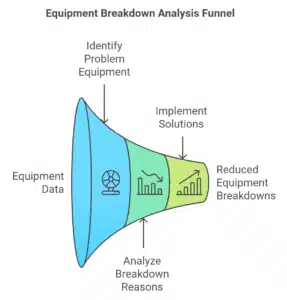
- Work in two stages: find the problem equipment (cost, downtime duration, complaints, statistics), then find the root cause (end-of-life, poor maintenance, poor operation, design flaw, or bad install).
- Always look at a full 12 months — shorter windows get skewed by seasonal maintenance spikes.
- Measure total downtime in hours, not availability percent. A percentage can stay flat while absolute downtime doubles — the raw hours are what reveal a problem machine.
- MTBF and MTTF are useful for comparing similar assets, but mislead when you have many different equipment types.
- This analysis is only practical when the data lives in one place — which is where a CMMS beats spreadsheets and memory.
The metrics that keep downtime down
You can’t reduce what you don’t measure. Our free Essential Maintenance Metrics guide covers the practical numbers that surround this analysis — including equipment downtime, preventive vs. breakdown time spent, and which equipment racks up the most breakdown time and cost — the same metrics FastMaint puts on your dashboard.
Get the free metrics guide →Why Downtime Reports Matter

A downtime report tracks when equipment isn’t operating as intended — whether it’s stopped for repair, waiting on parts, or fully broken down. Read correctly, these reports are how you improve reliability and cut costly disruptions.
The catch is scale. When you run many machines, the few that quietly eat your budget and your uptime are buried in the noise. Analyzing the data the right way is how you pull them out: spot recurring issues, trace root causes, and make maintenance decisions that actually move uptime instead of guessing.
Downtime: any period equipment is unavailable for production, planned or unplanned. Unplanned (breakdown) downtime is the expensive kind — it’s unscheduled, often urgent, and what this analysis targets first.
Downtime Metrics: Which Ones Actually Help
A few standard numbers come up in any downtime discussion — but they’re not equally useful, and which one matters depends on your situation. If you run many different types of equipment at one facility (most industrial and facilities teams do), keep this distinction in mind before leaning on any single statistic.
The metric to lead with: total equipment downtime (in hours)
To find problem equipment, measure total downtime in absolute hours per asset, not as a percentage. Raw hours don’t hide anything — if a machine’s downtime doubles, the number doubles, and the problem is impossible to miss.
Useful only for comparing similar assets: MTBF & MTTR
These two are valuable in a narrower situation — comparing equipment of the same type used in similar ways. They’re not facility-wide scorecards.
MTBF tells you how long an asset typically runs between breakdowns. Higher is better. It’s meaningful when you line up like-for-like machines — comparing the MTBF of a pump against a conveyor tells you nothing useful.
MTTR captures how long it takes to get a failed asset running again. Lower is better. A high MTTR often points to parts availability or skill/planning gaps rather than the equipment itself.
Stage 1: How to Find Your Problem Equipment
Review maintenance costs by equipment
Pull total maintenance cost (labor + materials + other) per asset over the last twelve months — both planned and unplanned. Avoid short windows; they skew results for equipment that only needs heavy work seasonally. Find your most expensive machines and check for anything out of line against manufacturer estimates and prior-year data. A classic tell: two near-identical machines with very different costs. In FastMaint, the Equipment History report gives you this per-asset cost breakdown for any period.
Review downtime duration
Look at downtime over the same twelve months — but filter out distortions. If an asset’s downtime is high only because parts weren’t available or a tech was pulled to a higher-priority job, that’s not the machine’s fault. FastMaint’s Equipment Downtime report summarizes downtime by asset and lets you drill into the individual work orders and log events behind it, so you can tell a genuine problem machine from a logistics delay.
Check complaints & work-request history
Review complaints and maintenance requests over twelve months. Assets with many complaints or repeat requests are flagged — but watch for duplication: a parts delay can generate several requests for the same unfixed machine. Filtering to problem work orders (a standard filter in FastMaint’s Work Order History report) helps you separate real recurring failures from delay-driven noise.
Review equipment statistics (MTBF, MTTF)
Use statistics to compare similar assets used in similar ways, and investigate any that sit way outside the pack. With many different equipment types, don’t force the comparison — it won’t be apples-to-apples. The Equipment History and Downtime reports let you line up costs and downtime for comparable assets and see which are genuinely out of line.
Don’t have these reports at your fingertips?
All four checks above assume you can pull a year of clean cost and downtime data on demand. That’s exactly what FastMaint does — import your equipment from a CSV and run the same reports referenced here. Try it free for 30 days. No credit card required.
Start your free 30-day trial →Stage 2: How to Find the Breakdown Reason & Fix It
Once you have a shortlist of problem equipment, dig into why each one fails. Frequent breakdowns almost always trace to one of five causes — and each has a different fix.
1. Close to end of life
You can keep almost anything running with enough maintenance, but there’s a point where it’s no longer worth it. Metal fatigue, scarce spare parts, lost maintenance skills, or newer equipment that’s simply more efficient are all signals.
Fix: Replace any asset on your list that fits this profile.
2. Poor maintenance practices
Skipped preventive maintenance, low-quality spares, or technicians not performing the job correctly. Watch for the same parts being replaced repeatedly, recurring issues tied to particular supplies, or skipped PM in the work-order history.
Fix: These assets need a better preventive maintenance plan (see our 7 tips to plan equipment preventive maintenance). Technicians may need training, and if poor-quality parts are the culprit, it’s time for a better vendor.
3. Poor operational practices
Operators using equipment incorrectly, or running it beyond what it was designed for. Technician feedback mentioning operator error is a clue; a critical asset that fails often despite proper maintenance may simply be overloaded.
Fix: Improve operator training, add capacity, or rework the operational flow to flatten peak loads.
4. Poorly designed or built
Internal flaws — like inadequate cooling causing overheating. If many identical machines all fail the same way, suspect a design or build issue, and check whether other organizations report the same fault.
Fix: Press the manufacturer to address it, or switch to better equipment from another vendor.
5. Incorrectly installed or set up
Equipment installed wrong, or damaged during install or startup. This looks like a design flaw but stays isolated to a few units rather than every similar machine — and outside research usually won’t surface widespread complaints. Comparing against manufacturer specs gives clues.
Fix: Inspect the affected units and re-install completely where needed.
What “Good” Downtime Looks Like
Industry rules of thumb exist, but here’s the honest caveat: targets vary widely by industry and asset type, and percentage-based benchmarks share the same blind spot we covered above — they can look healthy while absolute downtime hours climb. Treat these as directional context, not the thing you actually manage to.
Why a CMMS Makes This Practical
Every step in this guide depends on one thing: pulling a year of clean cost, downtime, and work-order data on demand, per asset. Spreadsheets and memory can’t do that reliably — if the data was never captured consistently, there’s nothing to analyze. This is where a CMMS earns its keep.
FastMaint is built for small maintenance teams who need this kind of reporting without a six-month rollout or a dedicated IT department. It’s complete enough to run a real downtime analysis — Equipment History, Equipment Downtime, and Work Order History reports out of the box — and simple enough that technicians actually log the work in the first place, which is what makes the data trustworthy. The reporting you need isn’t gated behind a higher tier; nearly everything is included at one price. Whether you run it as a cloud subscription or install and own it outright, the data’s there when you need to analyze it.
Two ways to get started
Take FastMaint for a spin with a free 30-day trial (no credit card), or grab the CMMS Selection Guide if you’re still comparing options for your team.
Start free trial See the selection guideFrequently Asked Questions
What is equipment downtime tracking?
It’s the practice of recording every period a machine is unavailable — planned or unplanned — along with the cause and duration. Tracked consistently over time, this data lets you identify which assets cost you the most uptime and why.
What’s the difference between MTBF and MTTR?
MTBF (mean time between failures) measures reliability — how long an asset runs between breakdowns; higher is better. MTTR (mean time to repair) measures maintainability — how long it takes to fix once it fails; lower is better. A high MTTR usually points to parts or planning problems rather than the equipment itself.
How much downtime data do I need before analyzing?
Use a full twelve months. Shorter windows get distorted by equipment that needs heavy maintenance only at certain times of year, making costs and downtime look misleadingly high or low.
Can I track downtime without a CMMS?
You can start in a spreadsheet, but it breaks down at scale — the per-asset cost, downtime, and work-order history you need for real analysis is hard to keep complete and consistent by hand. A CMMS captures it as you go and generates the reports for you.
Why isn’t MTBF useful across all my equipment?
MTBF is a fair comparison only between similar assets used in similar ways. Across many different equipment types, the numbers aren’t comparable — use them to flag assets that are wildly out of line, not to rank everything against a single benchmark.
Before you go: grab the metrics guide
The Essential Maintenance Metrics guide pairs perfectly with downtime analysis — the simple, useful numbers FastMaint puts on your dashboard so you can track breakdowns trending down year over year.
Get the free guide →Related reading
Essential Maintenance Metrics Every Planner Needs to Know
Get Free Guide