
Essential Maintenance Metrics Every Planner Needs to Know
Get Free Guide
3 Quick Maintenance Metrics Every Planner Should Track
Maintenance is a thankless job. When everything runs smoothly, nobody notices; when something breaks, everyone does. These three quick metrics give you an early-warning system for your maintenance program, so you can spot trouble and act before it turns into a breakdown.
Key takeaways
- Three fast metrics give a reliable read on program health: work order backlog, completion percent, and average days to complete.
- Watch trends, not single readings. A metric drifting the wrong way is the signal, so investigate the change, not the absolute number.
- The most valuable warning sign: backlog steady but completion percent falling. That means small jobs, usually PM checks, are being skipped, and it will bite you later.
- All three are easy to pull from a CMMS and hard to track reliably by hand, which is the whole point of having one.
Free guide: Essential Maintenance Metrics
All three metrics below are in our free Essential Maintenance Metrics guide, alongside five more: equipment downtime, preventive vs. breakdown time, and task estimating accuracy. Eight practical numbers every planner should know, the same ones on the FastMaint dashboard.
Why Track Maintenance Metrics At All?
Are you getting a lot of complaints about facilities or equipment maintenance? Is there a pile of pending work? Is it taking too long to close jobs out? Those frustrations usually have a measurable cause, and these three metrics help you pinpoint it.
Use them even when things are going well. They give you a quick read on program health and flag early actions to take when the numbers start drifting the wrong way. None is hard to collect if you run maintenance management software; the value is in watching how they move over time.
The golden rule of these metrics: a single reading tells you little. The trend is everything. A steady or improving trend is healthy; an unexpected change in any direction is your cue to investigate.
Metric 1: Work Order Backlog
Backlog is maintenance work that’s due but not yet completed, usually measured in hours or days. Over time, you want a backlog that’s holding steady or shrinking. You should always know roughly what your backlog is and which way it’s trending; big jumps need investigating.
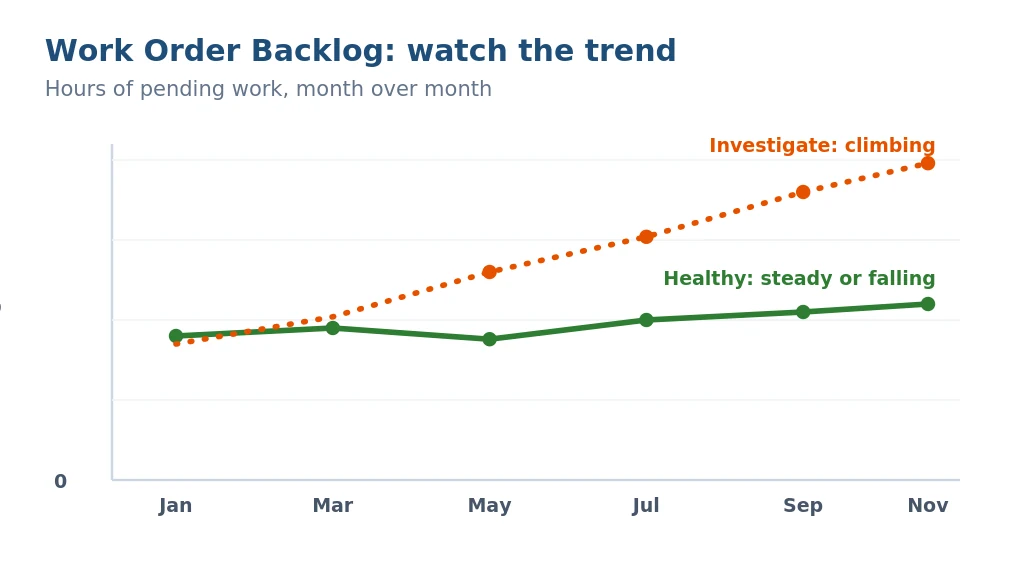
A rising backlog isn’t always bad. It can come from planned work, like a seasonal shutdown with a lot of equipment to service. But it can also mean planned maintenance keeps slipping due to schedule conflicts, or that you’re stuck waiting on critical spare parts.
What to do: if the delayed work isn’t critical, consider closing those work orders and rescheduling them. If parts shortages are the cause, work with suppliers to get delivery timed to your needs, and look at alternative suppliers if your current ones can’t keep up.
Metric 2: Work Order Completion Percent
This is the percentage of work orders scheduled in a period that actually got completed or closed. On its own it should stay fairly stable, tracking the same trend as your backlog. When the two diverge, you’ve found a problem.
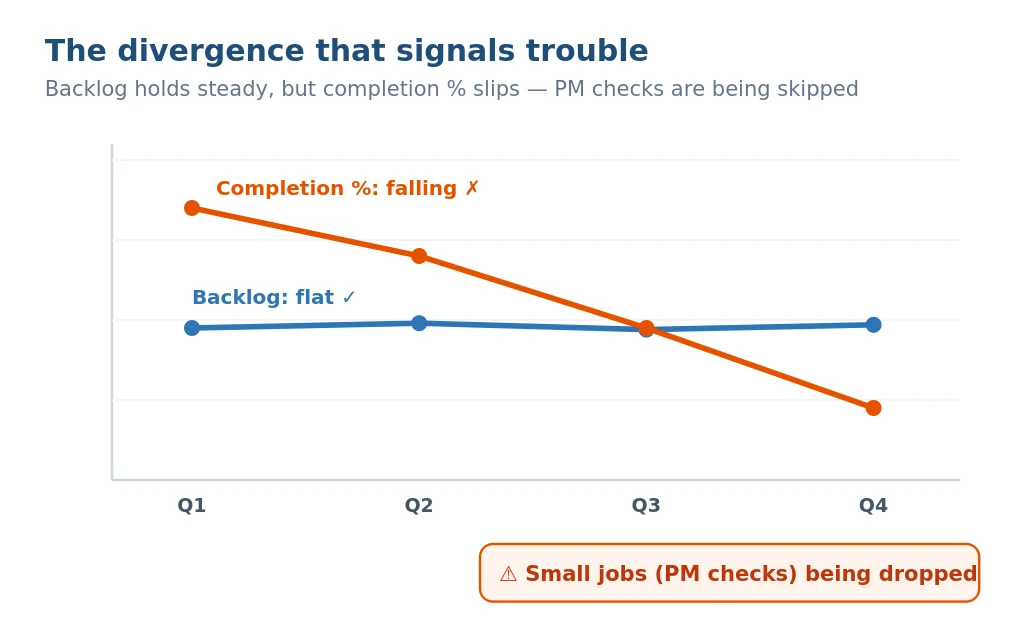
That makes completion percent a genuine leading indicator. A backlog that looks fine can hide a PM program that’s silently eroding, and this metric is how you catch it before the failures start.
Want these trends calculated for you?
FastMaint tracks backlog, completion percent, and days-to-complete automatically, so you see the trend without building a single spreadsheet. Try it free for 30 days. No credit card required.
Metric 3: Average Days To Complete Work Orders
This tells you how long, on average, a work order takes to close. You don’t want to see large swings here. A big increase signals trouble completing work, often spare-parts shortages or scheduling conflicts among technicians.
There’s a subtler case too: if backlog and completion percent both look fine but average days creeps up, work is still getting done, just slower. That’s where customer-satisfaction problems start, as other departments wait longer for maintenance.
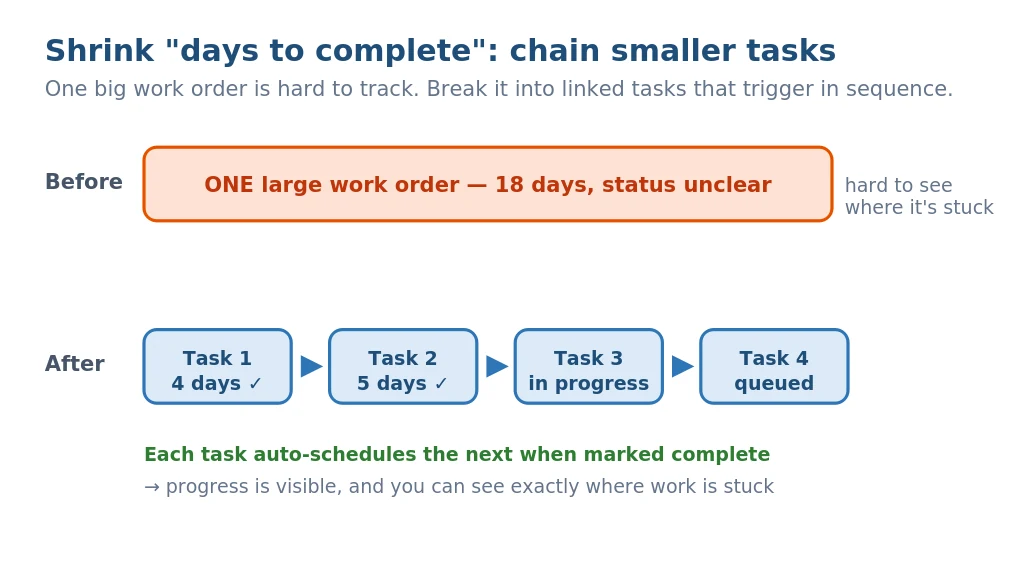
What to do: break large maintenance jobs into smaller tasks of a few days or less, each with its own work order. You can chain them — in FastMaint, the relative task feature schedules the next work order automatically when the current one is marked complete. Smaller linked tasks make progress easy to track and show you exactly where work is getting stuck.
Going Beyond The Three
These three metrics are a fast way to take the pulse of your program, but they’re not the whole picture. Once you’re comfortable watching their trends, it’s worth adding a few more: equipment downtime (in hours, not availability percent), the split between preventive and breakdown time, and how accurately you estimate task time, among others.
The common thread is that all of them depend on consistent, complete records. That’s the real reason a CMMS matters here: not for fancy dashboards, but because the data behind every one of these metrics has to be captured reliably as work happens. FastMaint is built for small maintenance teams who need that without a six-month rollout or a dedicated IT department. It’s complete enough to give you real metrics, and simple enough that technicians actually log the work, which is what makes the numbers trustworthy in the first place.
Two ways to get started
Take FastMaint for a spin with a free 30-day trial (no credit card), or grab the CMMS Selection Guide if you’re still comparing options for your team.
Frequently Asked Questions
What are the most important maintenance metrics for a planner?
Start with three quick ones: work order backlog, work order completion percent, and average days to complete. Together they give a fast, reliable read on program health. From there, equipment downtime and the preventive-vs-breakdown split are the natural next additions.
How often should I review these metrics?
Monthly is a good rhythm for most teams. What matters is consistency. You’re watching the trend over time, so review on a regular cadence and act on unexpected changes rather than reacting to any single month.
My backlog looks fine but completion percent is dropping. What does that mean?
It usually means small jobs are being skipped, most often preventive maintenance checks. They barely affect the backlog (measured in hours) but each one lowers the completion percent. It’s an early warning that PM is eroding and breakdowns may follow.
Can I track these metrics without a CMMS?
You can start in a spreadsheet, but keeping the underlying work-order data complete and current by hand is where it breaks down. A CMMS captures the data as work happens and calculates the trends for you.
Before you go: grab the metrics guide
The free Essential Maintenance Metrics guide covers all three metrics here plus five more, eight in total, the simple, useful numbers FastMaint puts on your dashboard so you can track your program’s health over time.
Related reading
Essential Maintenance Metrics Every Planner Needs to Know
Get Free Guide